The Tour de France is past its midway point and Dimension Data, which is processing and analysing all the Tour’s data, has compiled some of the most interesting stats so far.
So pump up those tyres, wriggle into that lycra and put on that helmet, because CBR is going to take you on a thrill ride of stats.
1. Distance
So far the riders have travelled 1,698.8 kilometres, or 1,055 miles. Considering that the distance from Lands End to John O’Groats is 874 miles, the riders would well be on their way on the return leg.
So far the longest stage has been stage four where the riders cycled 223.5km, or 138.8 miles. The shortest leg was stage one, the lazy so and so’s only cycled 13.8km (8.5 miles!).
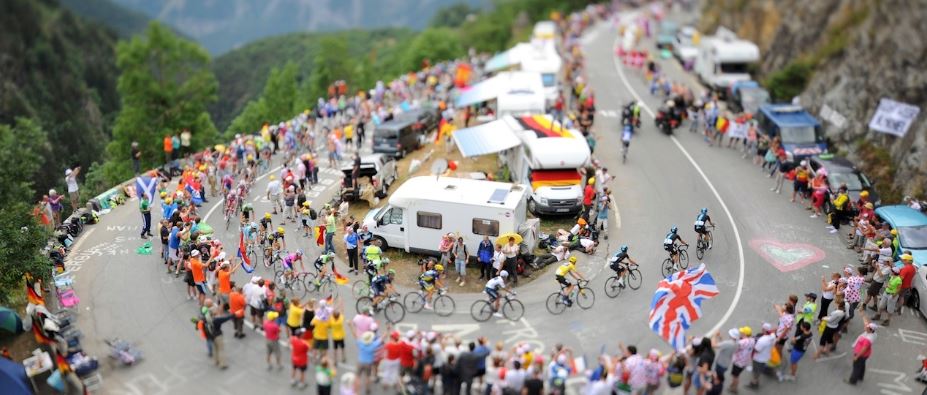
2. Speed
It’s not as if they are cycling at a leisurely pace, stopping off at local vineyards for a sip of the local tipple, they’re racing along at an average speed of 42km/h, or 26.3 mph.
The fastest stage was the first one where the riders sped along at just over 31mph. Stage 11 recorded the slowest average speed as they meandered along at a docile 21.1 mph.
The highest average speed of any stage winner so far comes from Rohan Dennis for BMC, he averaged 34.4mph.
Lars Boom recorded the highest speed so far, clocking in at 67.7mph.
3. Time + Retirement
The longest time gap between the first and last rider came in stage 11, as the demands on the body took their toll. It took 45 minutes and 47 seconds from first to last. The smallest gap was in the first stage with only 3 minutes 36 separating first to last.
Unsurprisingly stage 11 also recorded the largest number of retirements on a single day, with six deciding enough is enough. Stages nine, two and one had no one retire.
4. Steepest climb
So far, stage three has seen the steepest gradient on a climb, with riders facing a 19% uphill fight up Mur de Huy, which means Wall of Huy in English (thanks Google translate).
Stage 10 offered two steep gradients, a 10.8% and 10.3% on Col de Labays, none of which sounds appealing to me.
5. Data
Dimension Data is processing between 1.5 and 2.5 million records at each stage, with the BETA live tracking site dealing with up to 25,000 unique visitors at one time.
So far the most retweeted data visualisation is the crash data from stage three, which showed the average speed to be 26mph before the crash.
Some issues have been highlighted with tracking data, particularly in some areas of the route around mountains where signal transmissions were not received from the trackers.
Jeremy Ord, Dimension Data Executive Chairman, said: "What’s a particularly interesting statistic is that one of the most re-tweeted images to date is how the rider’s speed drops at the start of each Feed Zone while they pick up their food bags."